I was wondering as to whether ChatGPT can analyse the dataset if I copy-pasted it in chat’s text input field. One of the Gapminder datasets is “Mini” at Kaggle. It is a csv file. I prompted GPT-4 with request to analyse the dataset and to make a summary table with columns means and SD, and I also asked it to provide its own conclusions.

Then I just copy-pasted the content of csv file into ChatGPT text field and it almost immediately started making summary table. Just as requested means and SD.

The resulting table has values that are slightly off. The real values are as follows:

When I asked why did it make mistakes: “As an AI language model, I do not explicitly perform calculations in the traditional sense. Instead, my responses are based on patterns and knowledge learned from a vast dataset of text during my training.”
ChatGPT then proceeded churning out its interpretation of the data category by category.
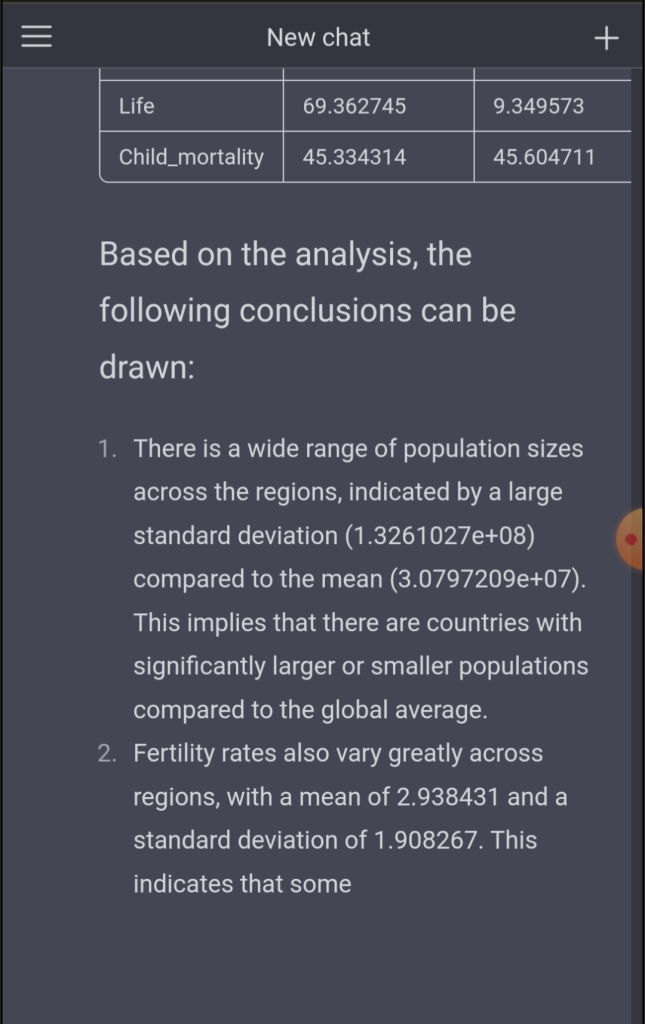
ChatGPT made similar observations for all 9 categories in the dataset, making an overall conclusion on disparities in health, economics and environmental factors across countries and regions. This is not a very deep analysis but it is an automatic one.
Here is the video of the entire process. The text generation part was sped up 10x.
ChatGPT-4 analyses “mini-gapminder” dataset.
Comments
Leave a Reply
Your email address will not be published. Required fields are marked *